Abstract
Internet-scale photo collections of real-world landmarks have driven progress in 3D computer vision yet remain highly challenging for modern 3D foundation models (3DFMs) that estimate scene structure in a single feed-forward pass. In this work, we introduce ArchWorld, a benchmark of 3D architectural landmarks with high geographic coverage and rich metadata. We use this benchmark to conduct a thorough error analysis of current 3DFMs to understand where they fall short and how they can be improved. We examine socially relevant disparities in model error and find that model performance varies by geographic region; however, unlike typical fairness regimes, the trends only partially match training data representation. Our investigation reveals that the observed geographic disparities reflect not only differences in data representation and scene size but also differences in region-specific architectural features and background distractors that make scenes from different regions inherently vary in difficulty. Leveraging insights from these model failings, we introduce an intervention scheme that improves 3DFM performance while simultaneously reducing geographic disparities.
The ArchWorld Benchmark
We present the first error analysis aimed at studying 3DFM behavior across the socially relevant dimensions of geographic regions and architecture types (e.g., mosques, churches). To do this, we construct ArchWorld, a dataset of 3D scenes with meaningful coverage of architectural landmarks from eight regions: Africa, East Asia, Europe, Latin America, North America, South Asia, Southeast Asia, and West/Central Asia.
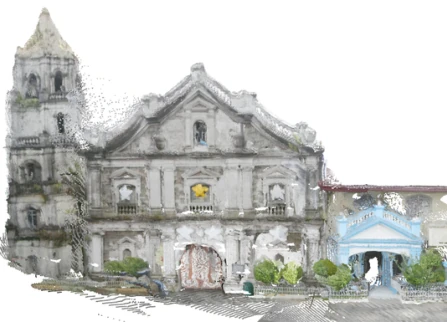
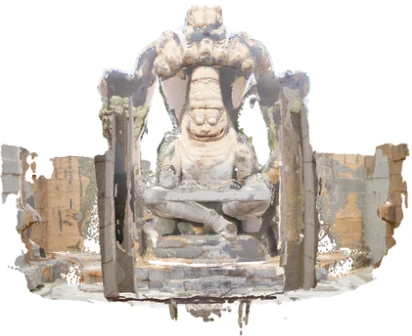
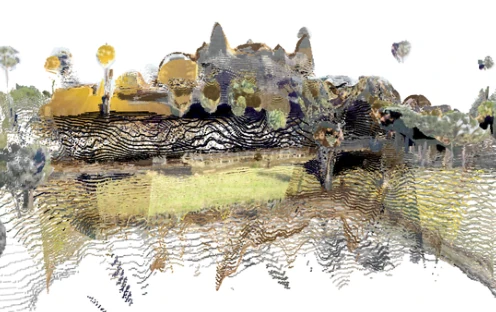
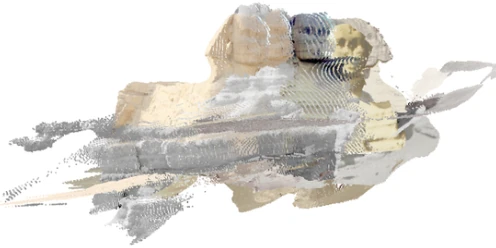
Above, we show a sample scene from each region in ArchWorld. Each scene combines an internet photo collection, a dense 3D reconstruction, and scene metdata. The metric scale factor, which converts the reconstruction to meters and gives the scene extent and the distances shown, was annotated manually for each scene. Additionally, we manually annotated scene-specific 3D masks that were used to refine each point map down to just the landmark itself.
Where Do 3D Foundation Models Fall Short?
We benchmark VGGT, Depth Anything 3, and π3 on ArchWorld, measuring reconstruction error with Chamfer Distance (m) and \(\widehat{\mathrm{CD}}\), a normalized version of Chamfer Distance that we introduce. The table below reports each model's median CD and \(\widehat{\mathrm{CD}}\) by geographic region, revealing clear regional disparities that persist even for π3, the best-performing model.
We also find that regional disparities persist even within the same architecture type, broadly following the overall geographic trends. Below, we show π3's median \(\widehat{\mathrm{CD}}\) for each region and type of religious building (churches, mosques, and temples), along with an example scene for each median.
Examining the corresponding median reconstructions provides further insight into how architectural features and surrounding scene complexity may contribute to these disparities. For instance, π3 struggles to reconstruct minarets in both the Muhammad Ali Mosque in Africa and the Nasir-ol-Molk Mosque in West/Central Asia. However, the smaller minarets of Nasir-ol-Molk occupy a smaller fraction of the scene, limiting their contribution to the overall reconstruction error. The relatively poor performance of Mary, Queen of the World Cathedral in North America illustrates a different challenge: its dense urban surroundings introduce spurious geometry that increases reconstruction error. We observe similar failures across other North American scenes, suggesting that urban complexity contributes to the region's relatively poor performance, despite North America's high representation in the training dataset. In contrast, Southeast Asia, an underrepresented region, performs extremely well because it is largely (68%) composed of simple church facades. Together, these observations suggest that geographic disparities reflect not only differences in data representation, but also variations in architectural types and scene complexity.
ArchAttend
To further understand these failures, we first examine how 3D foundation models distribute cross-view attention across architectural and non-architectural elements. Rather than analyzing individual patch pairs, we aggregate this patch-level attention over semantic elements, i.e., groups of patches that depict the same element. In particular, we examine which kinds of architectural elements the model concentrates its cross-view attention on, and compare attention patterns between scenes with large and small reconstruction errors.
To support this investigation, we annotate each scene with pixel-level masks corresponding to two element sets: a set of architectural elements \(\mathcal{E}_{\mathrm{arch}}\) and a set of non-architectural elements \(\mathcal{E}_{\mathrm{non}}\). We denote the full element set \(\mathcal{E} = \mathcal{E}_{\mathrm{arch}} \cup \mathcal{E}_{\mathrm{non}}\) and use SAM 3 to segment elements across all images of each scene. We visualize Semantic Cross-View Attention (SCVA) by aggregating attention from each query patch \(i\) to key patches that share its semantic element.
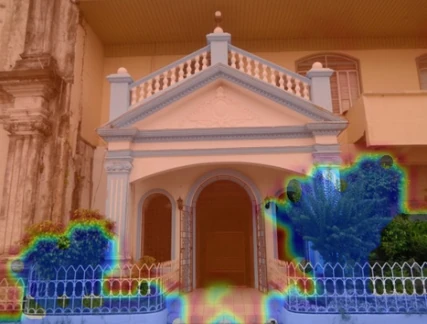
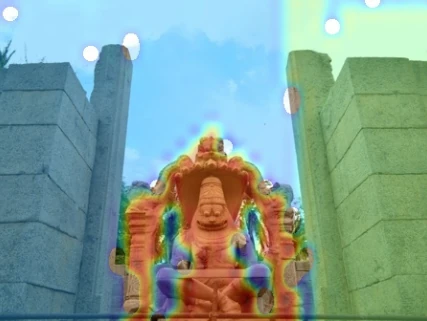
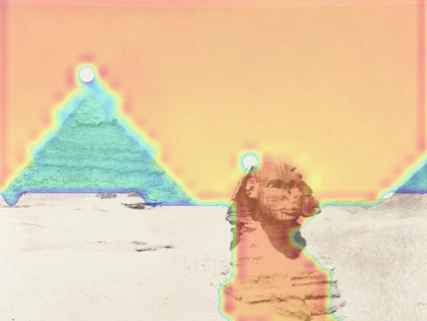
Here, \(\mathcal{P}_e\) is the set of patches across all input views covered by the segmentation mask of \(e \in \mathcal{E}\), and \(\mathbf{A}^{l}\) is the attention matrix of the \(l\)-th global attention layer averaged over heads. We visualize the SCVA score, the amount of attention each patch places on its own element in the other views (warm = high, cold = low).
Low reconstruction error
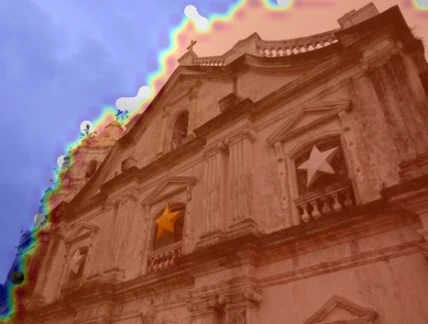
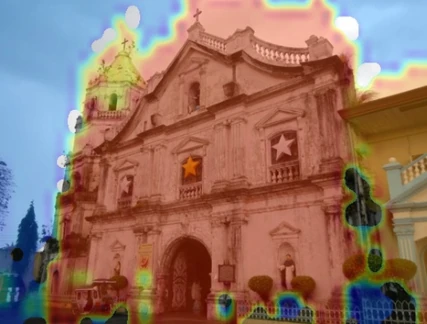
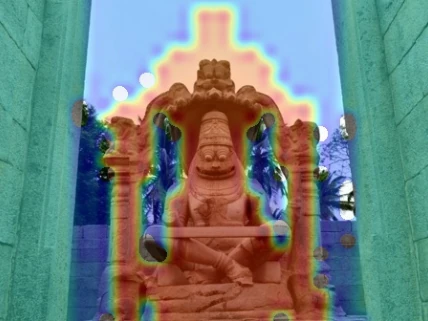
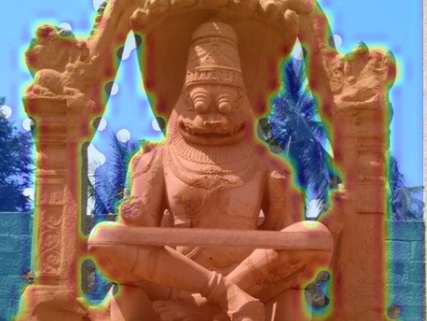
Attention concentrates on architectural regions.
High reconstruction error



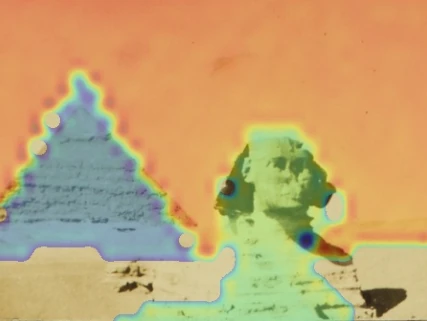
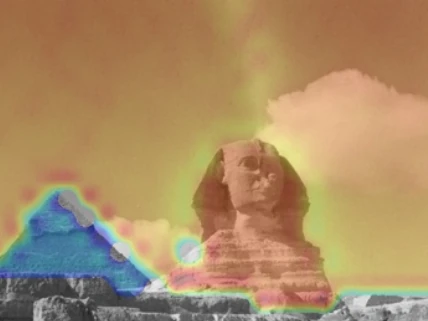
Attention leaks onto non-architectural patches.
SCVA maps reveal a striking pattern: in scenes with low reconstruction error, cross-view attention concentrates on landmark-centric patches, while in high-error scenes it leaks onto semantically irrelevant regions (e.g., sky, water) that contribute little signal for reconstruction. To improve reconstruction in challenging scenes, we aim to redirect attention from such distractors toward semantically important architectural patches.
We propose ArchAttend, a 2-pass method that first identifies the main architectural element on which the model should establish correspondences, then increases attention to that element via gradient-ascent updates on the token representations. For each scene, ArchAttend selects an anchor element from \(\mathcal{E}_{\mathrm{arch}}\) that received the strongest cross-view attention.
By aggregating over the per-patch SCVA, we define the cumulative element-wise attention score at the last layer \(l_{\mathrm{last}}\) as
This score measures the total cross-view attention directed toward element \(e\), so that elements with stronger correspondence across views receive higher scores. The anchor is therefore \(e^* = \arg\max_{e \in \mathcal{E}_{\mathrm{arch}}} S^{l_{\mathrm{last}}}(e)\).
Results
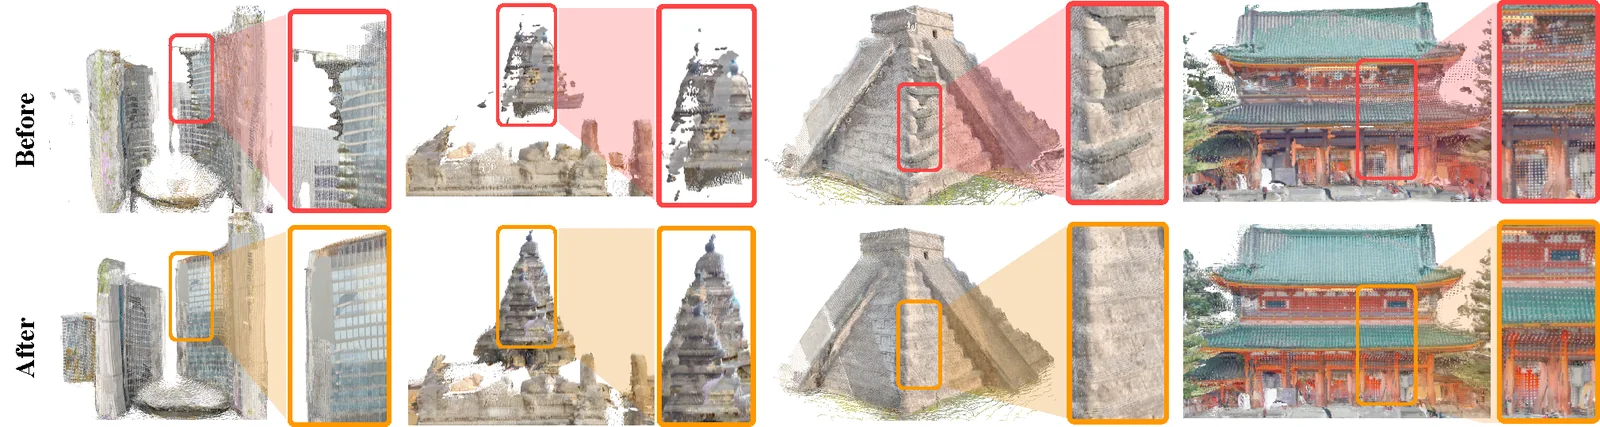
Applied to DA3, ArchAttend lowers median \(\widehat{\mathrm{CD}}\) and narrows the gap between regions and architecture types.
static/images/fig_qualitative.webpBibTeX
@inproceedings{kriplani2026archworld,
  title     = {Towards Reconstructing Geographically Diverse Architecture with 3D Foundation Models},
  author    = {Kriplani, Nicky and Zhang, Yiwen and Wang, Angelina and Averbuch-Elor, Hadar},
  booktitle = {Advances in Neural Information Processing Systems (NeurIPS)},
  year      = {2026}
}